|
|
|
|
Lyon's Auditory Model
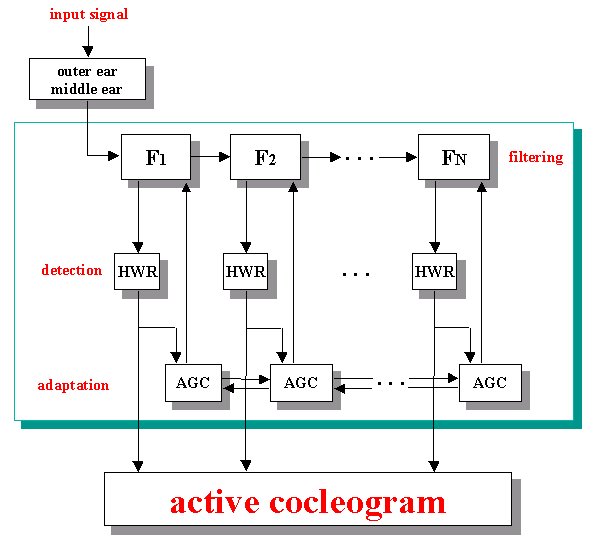
| The Lyon's auditory model [1], schematically illustrated in the block diagram on the rigth, describes with particular attention the behaviour of the cochlea, the most important part of the inner ear, that act substantially as a non-linear filter bank. Due to the variability of its stiffness, different places along the cochlea are sensible to sounds with different spectral content. In particular, at the base the cochlea is stiff, while going on it becomes less rigid and more sensible to low frequency signals. The software implementation of the Lyon's auditory model whose this section refers to, is that resulting from M. Slaney [2] work. | 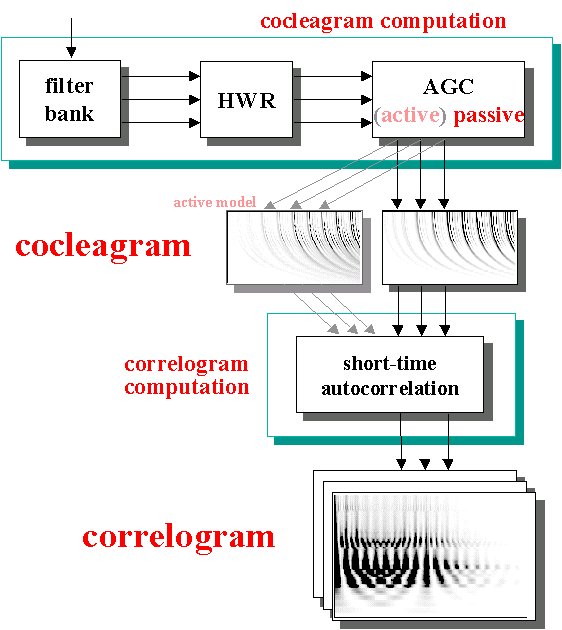 |
|
|
|
| This behaviour is simulated in the model, by a cascade filter bank. The bigger the number of these filter the more accurate is the model. In front of these stages there is another stage that simulate the effects of the outer and middle ear (pre-emphasis). In our experiments we have considered 86 filters. This number depends on the sampling rate of the signals (16 kHz) and on other parameters of the model such as the overlapping factor of the band of the filters, or the quality factor of the resonant part of the filters. | 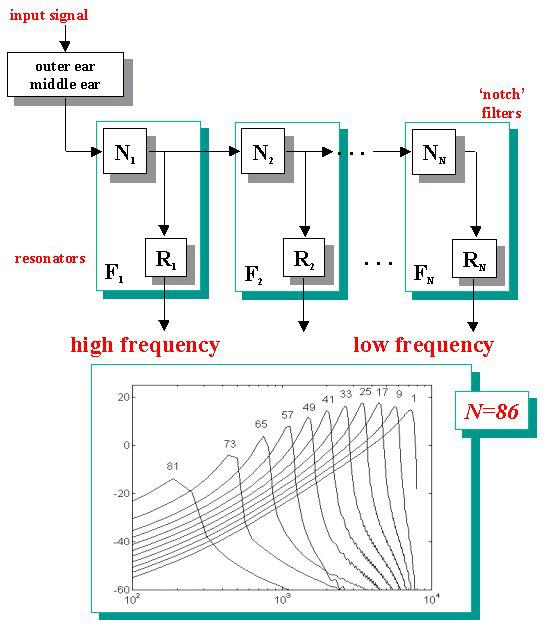 |
|
|
|
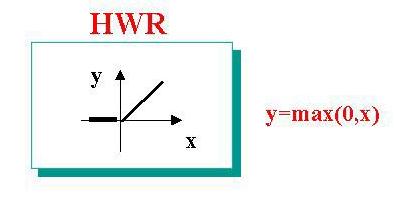
| The next part of the model consists of an ideal half wave rectification (HWR), composed of a bank of HWRs which have the function to drop the negative portions of the waveform, modelling the directional behaviour of the inner hair cells, thus cutting the energy of the signal by approximately two. | |
|
|
|
| The final part of the model describes the adaptive features which work in our auditory system. This part cosists of four automatic gain control (AGC) stages that are cascaded. The signals of each channel coming out of the HWR stages, pass through these four AGC stages. The value of the gain of each stage depends on a time constant, on the value of the preceding output sample and on the values of the preceding output samples of the adjacent channels. In this way it is possible to reproduce the masking effects. The different time constants simulate the different adaptive times of our auditory system: the first AGC stage has the biggest time constant so that it reacts to the input signal more slowly, while the following stages have decreasing time constants. The outputs of these stages apppoximately represent the neural firing rates produced by the solicitation of various parts of the cochlea due to the sound pressure waves entering the outer ear. | 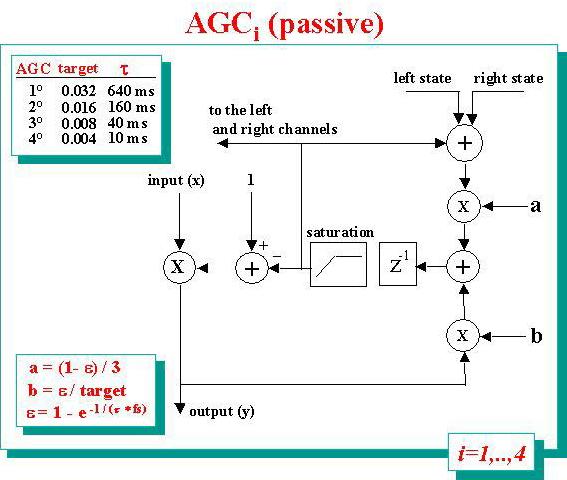 |
|
|
|
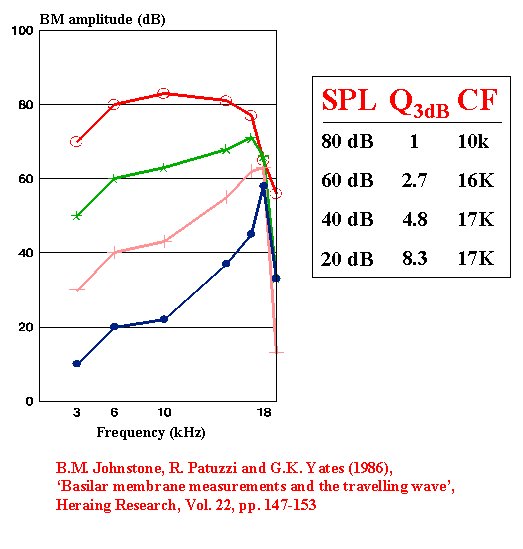
| As for the analysis, the possibility to realize a more realistic active
cochlea model, such as one resulting from B.M.
Johnstone, R. Patuzzi and G.K. Yates measurements on Basilar membrane [3], has been investigated. A computer model based on Lyon's
model features has been implemented. Filters
varying dinamically their gain, following the have been used in this model. With
this particular structure if the input signal is weak it is enphazised, while if it is
loud the filters reduce their gain. To achieve this result, a cascade of resonators with
time constants growing exponentially has been used [4]. In the
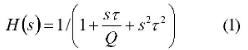
s domain the trasfer function of these filters is given by : where t and Q are respectively the time constant and the Quality factor of the resonator. These two parameters determine the resonance frequency of the stage. The bilinear transformation, to convert this transfer function into the z domain, has been used. The Q parameter of each resonator varies and, more precisely, its value depends on the previous output sample. This value has been calculated by taking the positive part of the output of the filter and adapting it in order to make it compatible with a range of values from to 1 / sqrt(2) to 1. This kind of feedback permits to modify the Q values of the filters depending on the amplitude of the input signals. When Q = 0.707 there is no resonance, while when Q = 1 there is a peak of resonance and therefore there is an interval of frequencies for which the gain is greater than unity. In our implementation and in our analysis-synthesis (inversion) tool we have not yet considered this model due to the difficulties lying on the problem of its inversion [5], [6], [7], [8]. |
 |
 |
|
|
|
|
| The results obtained by the auditory model, also called cochleagrams, are two dimensional representations: time and frequency. The frequency discrimination depends on the number of channels. On this kind of representation further operations are made in order to simulate what happens at cortical level. | 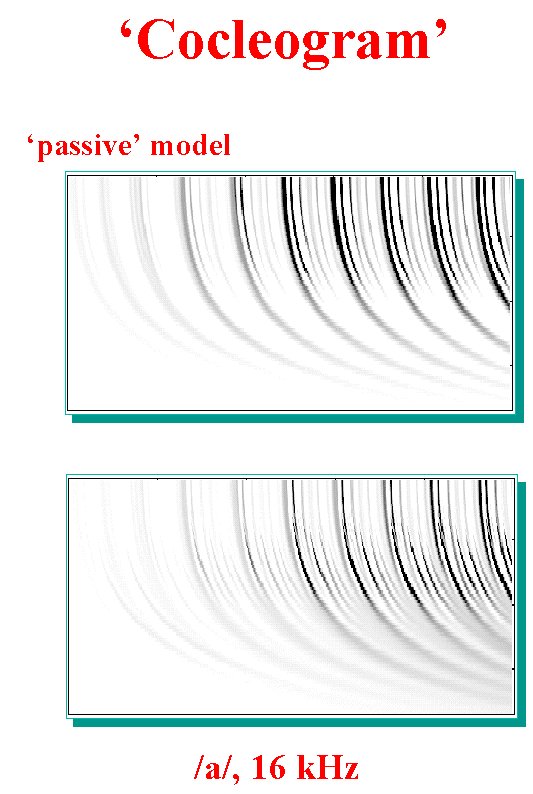 |
|
|
|
| It has been supposed that the neural firings are subsequently autocorrelated so that it is possible to get a clear information about the periodicity of these patterns [9]. It is then probable that our brain uses this kind of information to achieve sound recognition capabilities, such as isolating signal from noise, separating sounds, or ordering sounds with different pitches. According to this hypothesis the outputs of all the channels of the cochleagram are autocorrelated. More precisely, as we have to consider non stationary signals (like speech), we calculate the Short Time Autocorrelation (STA) of each output of the auditory model, that is we calculate the autocorrelation of temporal windows that are overlapped and separated by a constant quantity. The result of this operation is called correlogram and it is a three dimensional representation, in fact we can get information about time, frequency and autocorrelation lag. The correlogram allows us to see where energy is located in frequency, but also the value of the autocorrelation lag for which the signals of the cochlear channels have the same periodicity. In other words it is possible to see how the pitch of the input signal varies in the time domain [10], [11]. | 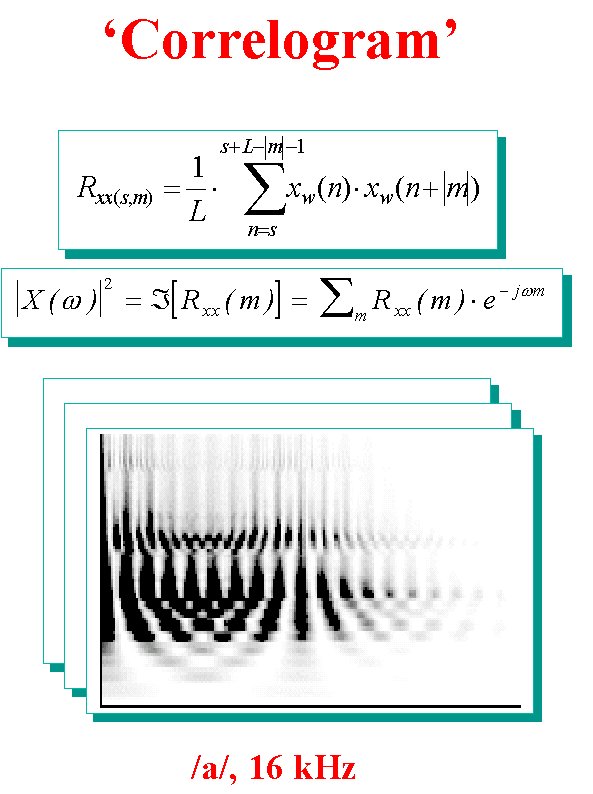 |
|
|
|
References
[1] R. F. Lyon (1982), "A Computational Model of Filtering, Detection, and Compression in the Cochlea", in Proceedings of IEEE-ICASSP-82, pp. 1282-1285.
[2] M. Slaney (1988), "Lyon's Cochlear Model" (Techn. Rep. # 13) Apple Computer Inc. Cupertino, Ca., 1988.
[32] B.M. Johnstone, R. Patuzzi and G.K. Yates (1986), "Basilar Membrane measurements and the travelling waves", Journal of Hearing Research, Vol. 22, pp. 147-153.
[4] R.F. Lyon and C. Mead (1988), "An Analog Electronic Cochlea", IEEE -ASSP, Vol. 36, pp. 1119-1133.
[5] P. Cosi and E. Zovato (1996), "Lyon's Auditory Model Inversion: a Tool for Sound Separation and Speech Enhancement ", Proceedings of ESCA Workshop on 'The Auditory Basis of Speech Perceprion', Keele University, Keele (UK), 15-19 July, 1996, pp.194-197. (pdf)
[6] P. Cosi (1998), "D, DD, DDD, DDDD …… Evidences Against Frame-Based Analysis Techniques", in Proceedings of NATO Advance Institute on Computational Hearing, Il Ciocco, 1-12 July, 1998, pp. 163-168. (pdf)
[7] P. Cosi, S. Pasquin and E. Zovato (1998), "Auditory Modeling Techniques for Robust Pitch Extraction and Noise Reduction", in Proceedings of ICSLP-98, International Conference on Spoken Language Processing, Sydney, Australia, 30 Nov. - 4 Dec., 1998, Volume 7, pp. 2807-2810. (pdf)
[8] P. Cosi (1998), "Auditory Modeling and Neural Networks", in A Course on Speech Processing, Recognition, and Artificial Neural Networks, Springer Verlag, Lecture Notes in Computer Science, in fase di stampa. (pdf)
[9] J.C.R. Licklider (1951), "A Duplex Theory of Pich Perception", Experiantia, 7, pp. 128-133.
[10] M. Slaney and R.F. Lyon (1990), "A Perceptual Pich Detector", in Proceedings of IEEE-ICASSP, pp. 357-360.
[11] M. Slaney and R.F. Lyon (1993), "On the Importance of Time: A Temporal Representation of Sound", in Cooke M., Beet S. and Crawford M. (Eds.): Visual Representations of Speech Signals, Wiley & Sons, Chichester, pp. 95-115.